Use Case Customer Lifecycle Value
Using DataQA to quickly feedback and iterate on ML predictions of Customer Lifecycle Value
-
Industry
E-commerce
-
Use Cases
Data Analysis, Feedback and Review, Prediction Visualization, Quality Assurance
-
Results
The marketing manager quickly spots anomalies in the ML predictions during development.
Introduction
DataQA lets your data science teams work closely with the rest of your organization. Simple to use query and visualization tools allow key stakeholders to provide valuable insights and feedback during the ML development process.
ML Development
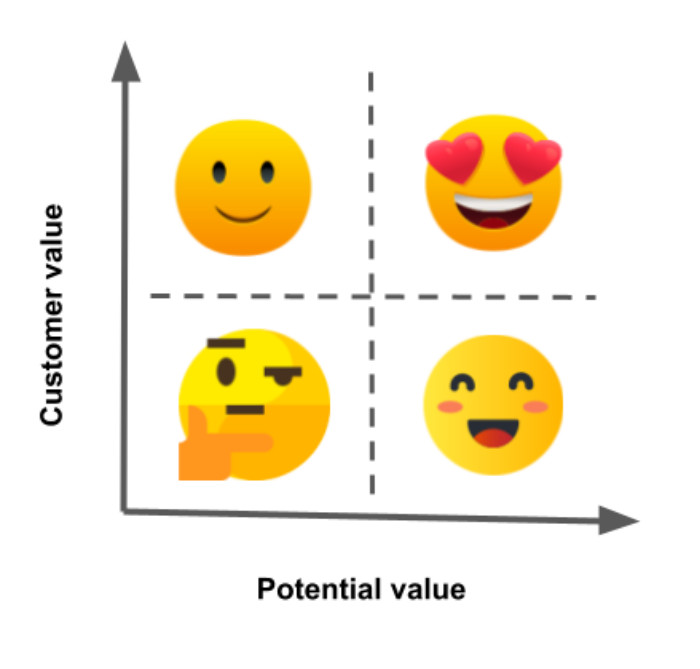
The data scientist has been given the task to predict spending of customers, and segment them according to some predefined criteria. The segment a customer falls in will impact the campaigns and offers this customer will receive in the future.
After some conversations with the marketing manager, and the data engineer, the data scientist has gained some understanding into how the data is stored and what each field represents.
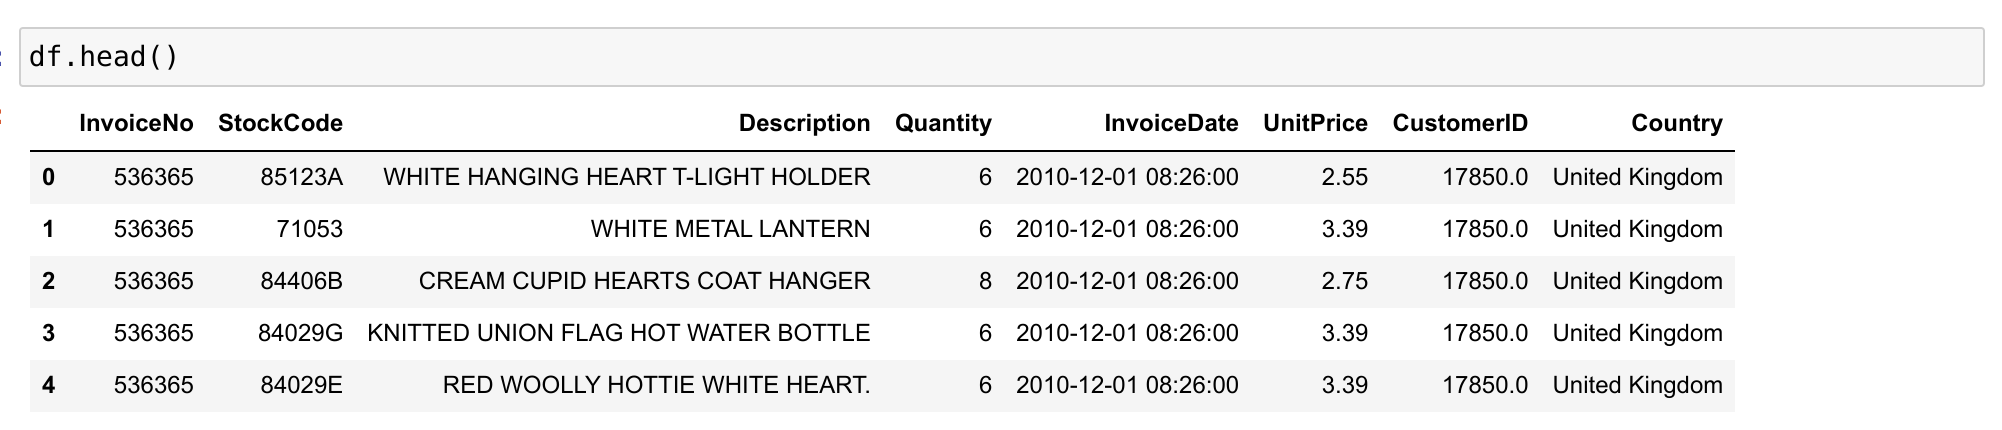
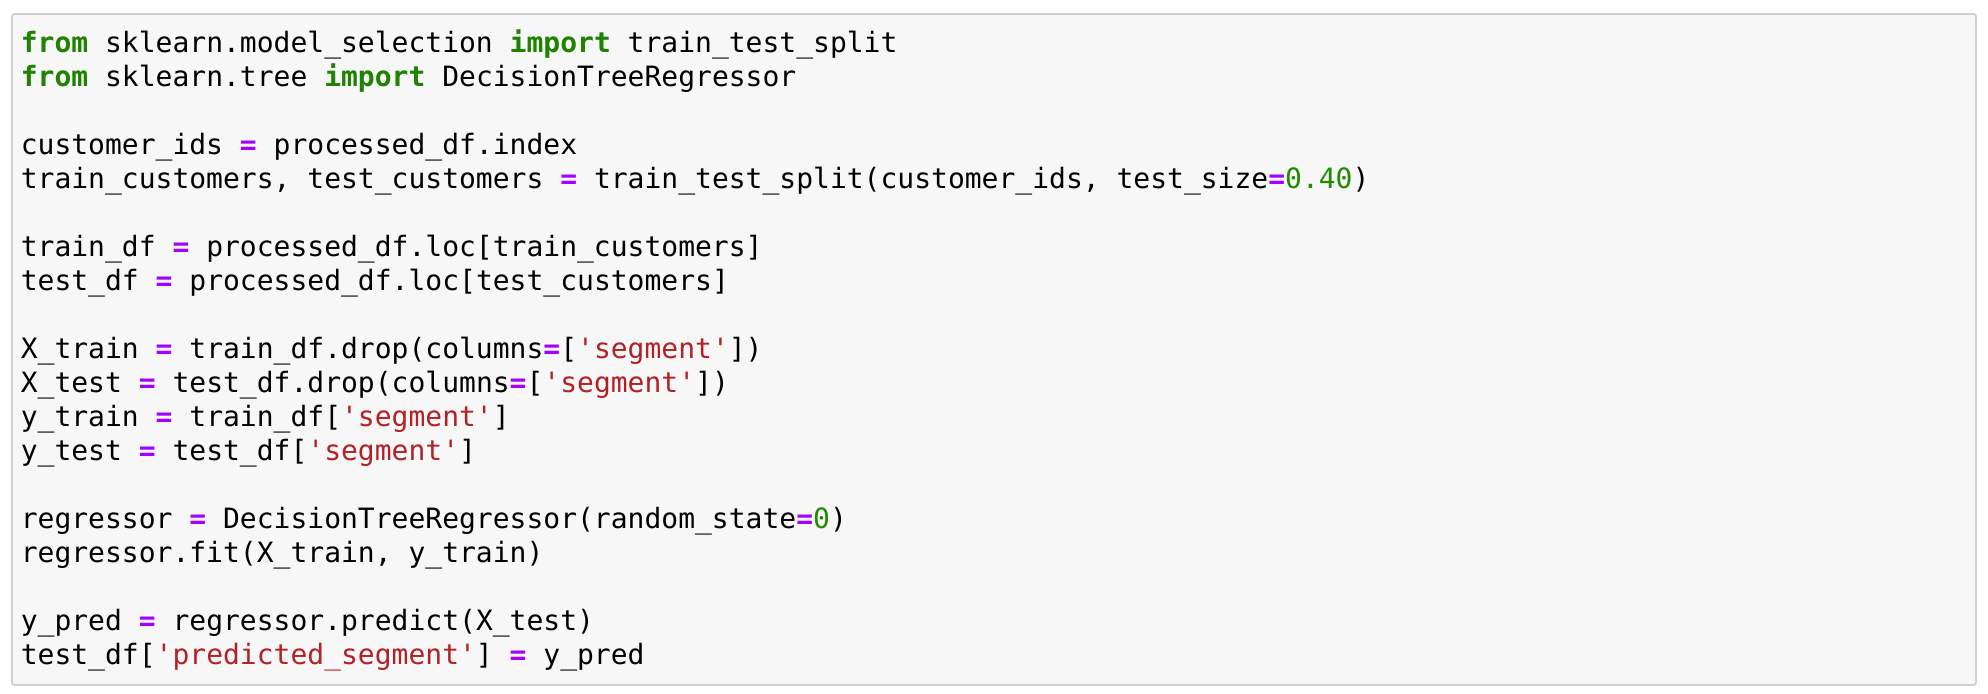
She’s now ready to start developing a predictive model. In her familiar development environment, she runs a few experiments involving feature engineering and different models. She ends up with a test dataset containing customer behaviour information and the predictions from her model for total spend and customer segment.
The overall metrics look good enough, but some of the ML metrics typically used for this type of problems such as root-mean square error can be difficult to interpret and tie back to the business.
Rather than falling into a development trap where the model can be improved for weeks or months, this is the right time to involve the marketing expert to assess the quality of the results, and find any potential issues.
Once the test dataframe with the predictions is ready for review, creating an interactive app with DataQA is just a few lines of code.
from dataqa import DataQA

dataqa = DataQA()
dataqa.login()

dataqa.publish(PROJECT_ID, test_df)
Running the code above prints out a url that can now be shared with the marketing manager for him to explore and check the results.
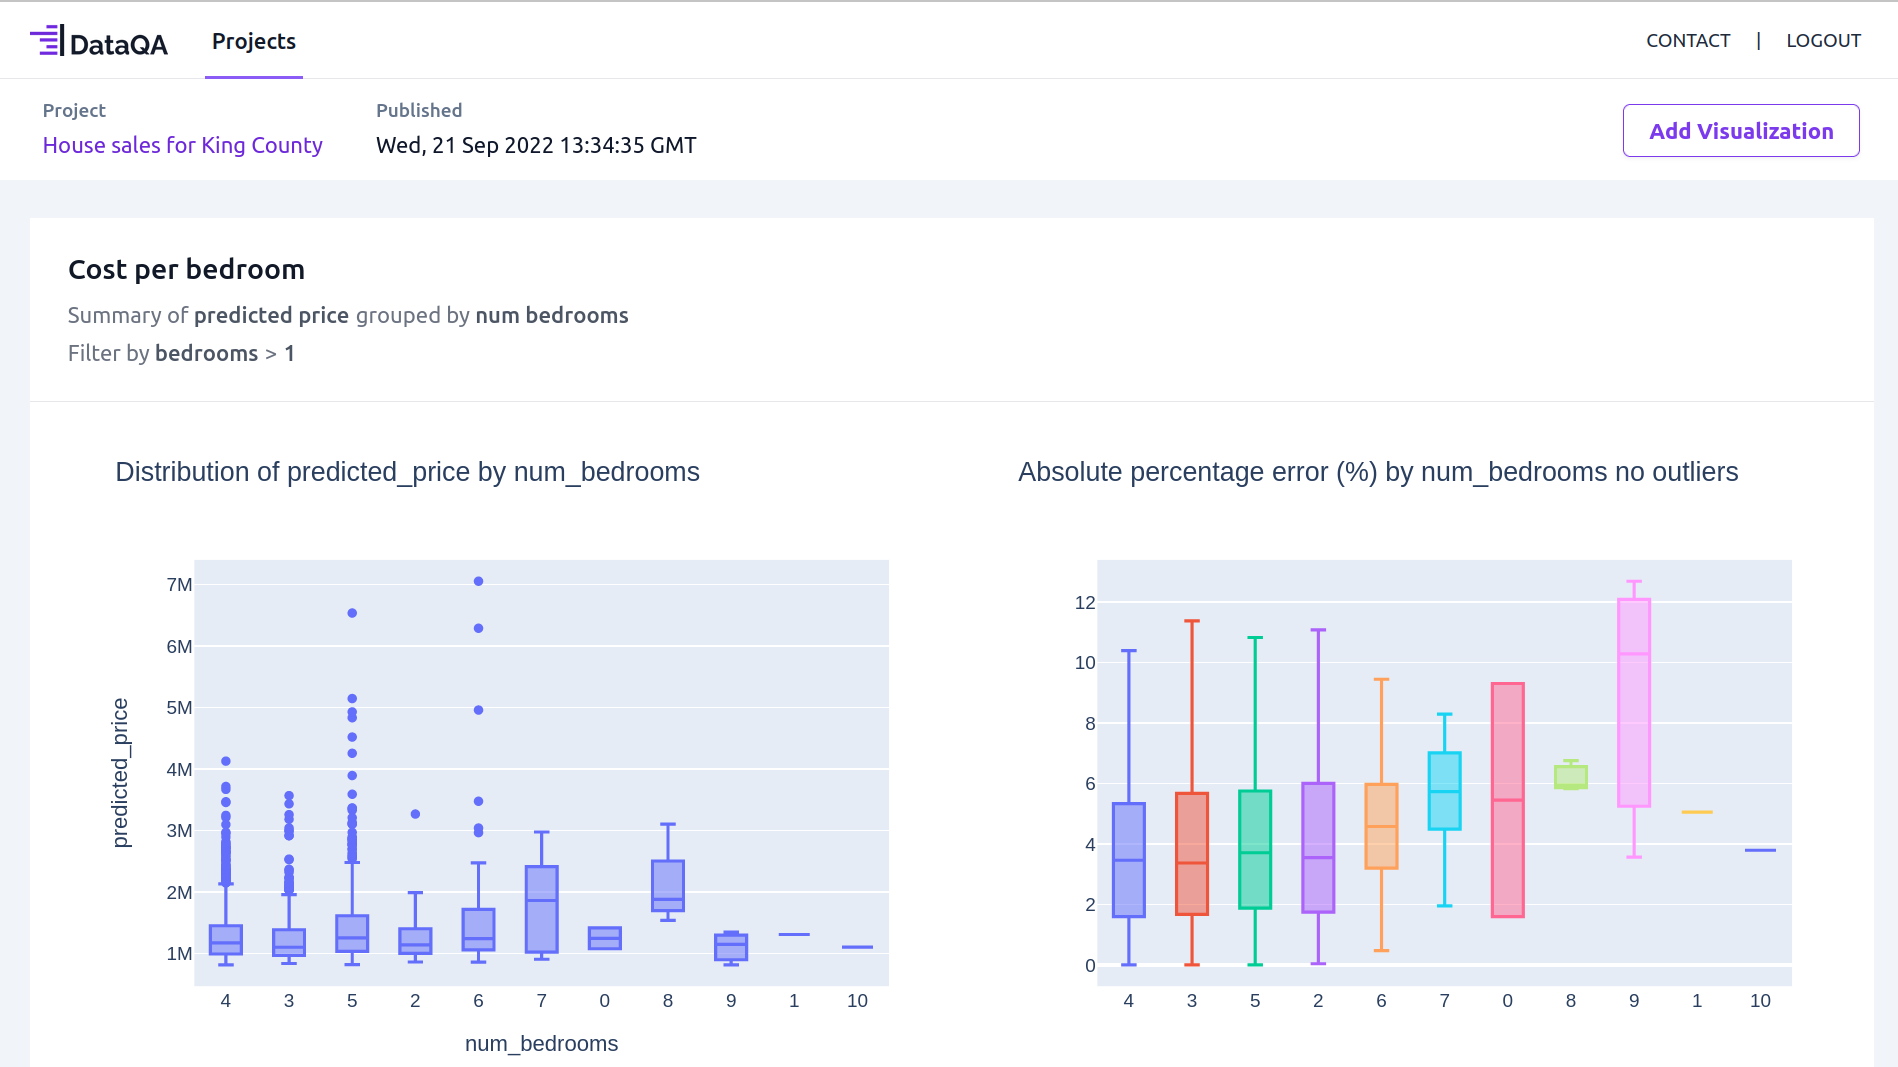
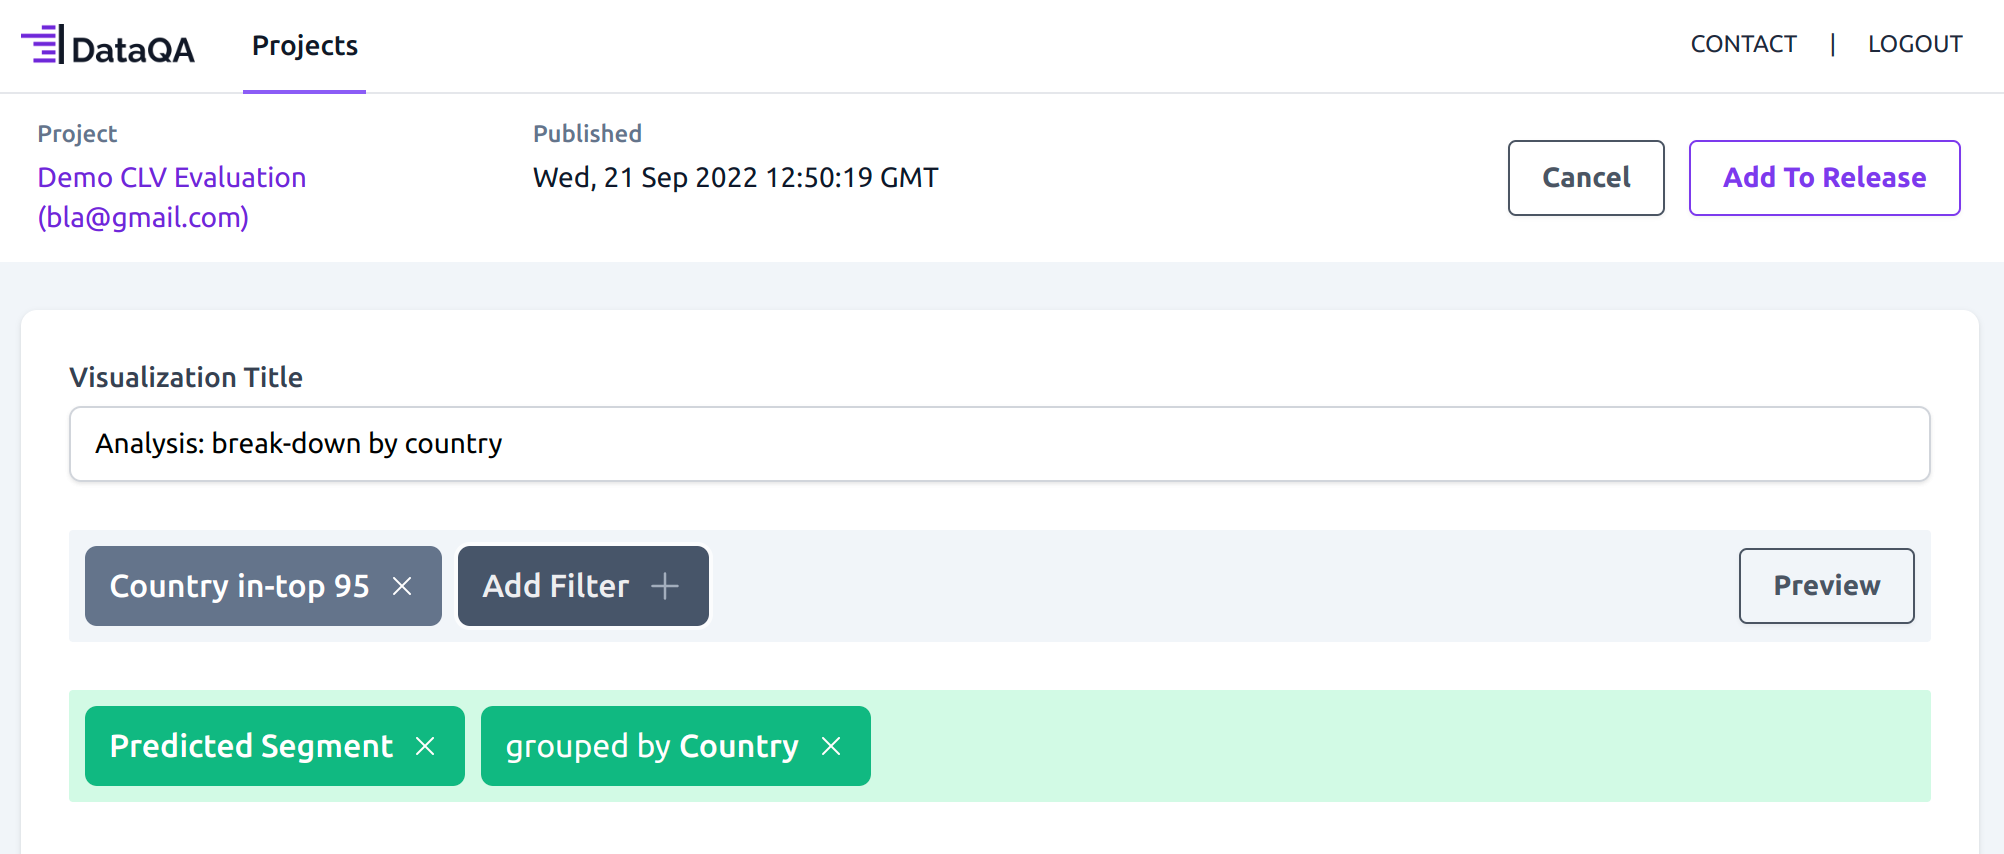
Expert Analysis in DataQA
DataQA’s intuitive no-code interface allows the user to perform operations on the data to get to the right level of insights. And this is done independently without the need to ask the data scientist to plot anything else.
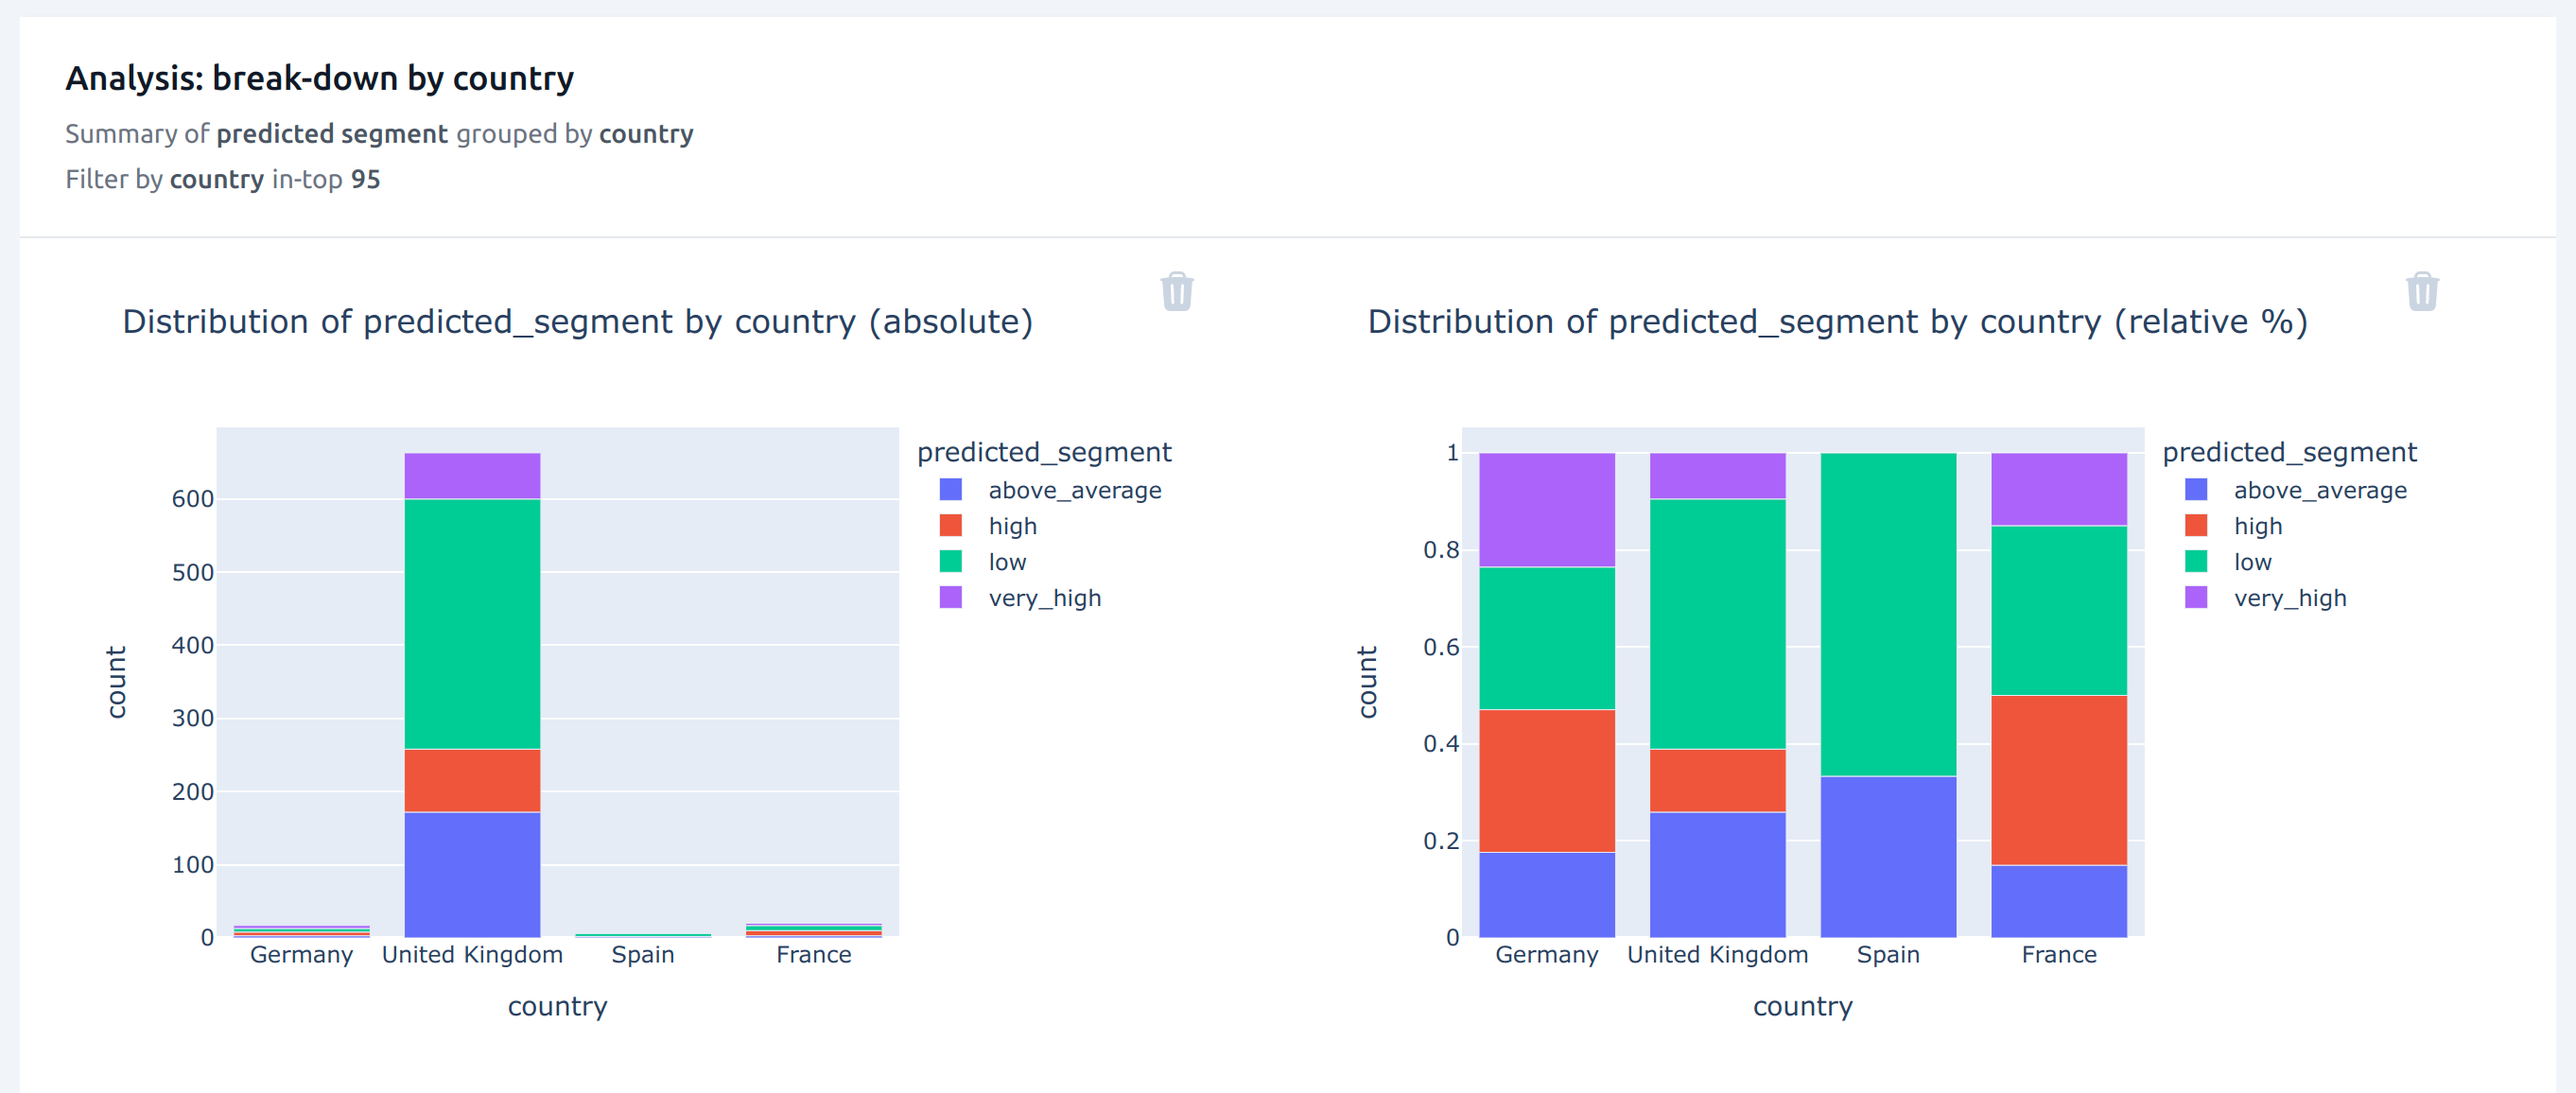
The first thing the marketing manager might be interested in looking at is the country break-down of the data, to make sure the data that was used for training the model is representative of the customer base at the company. What he sees is that most of the customers are based in the UK, which is expected.
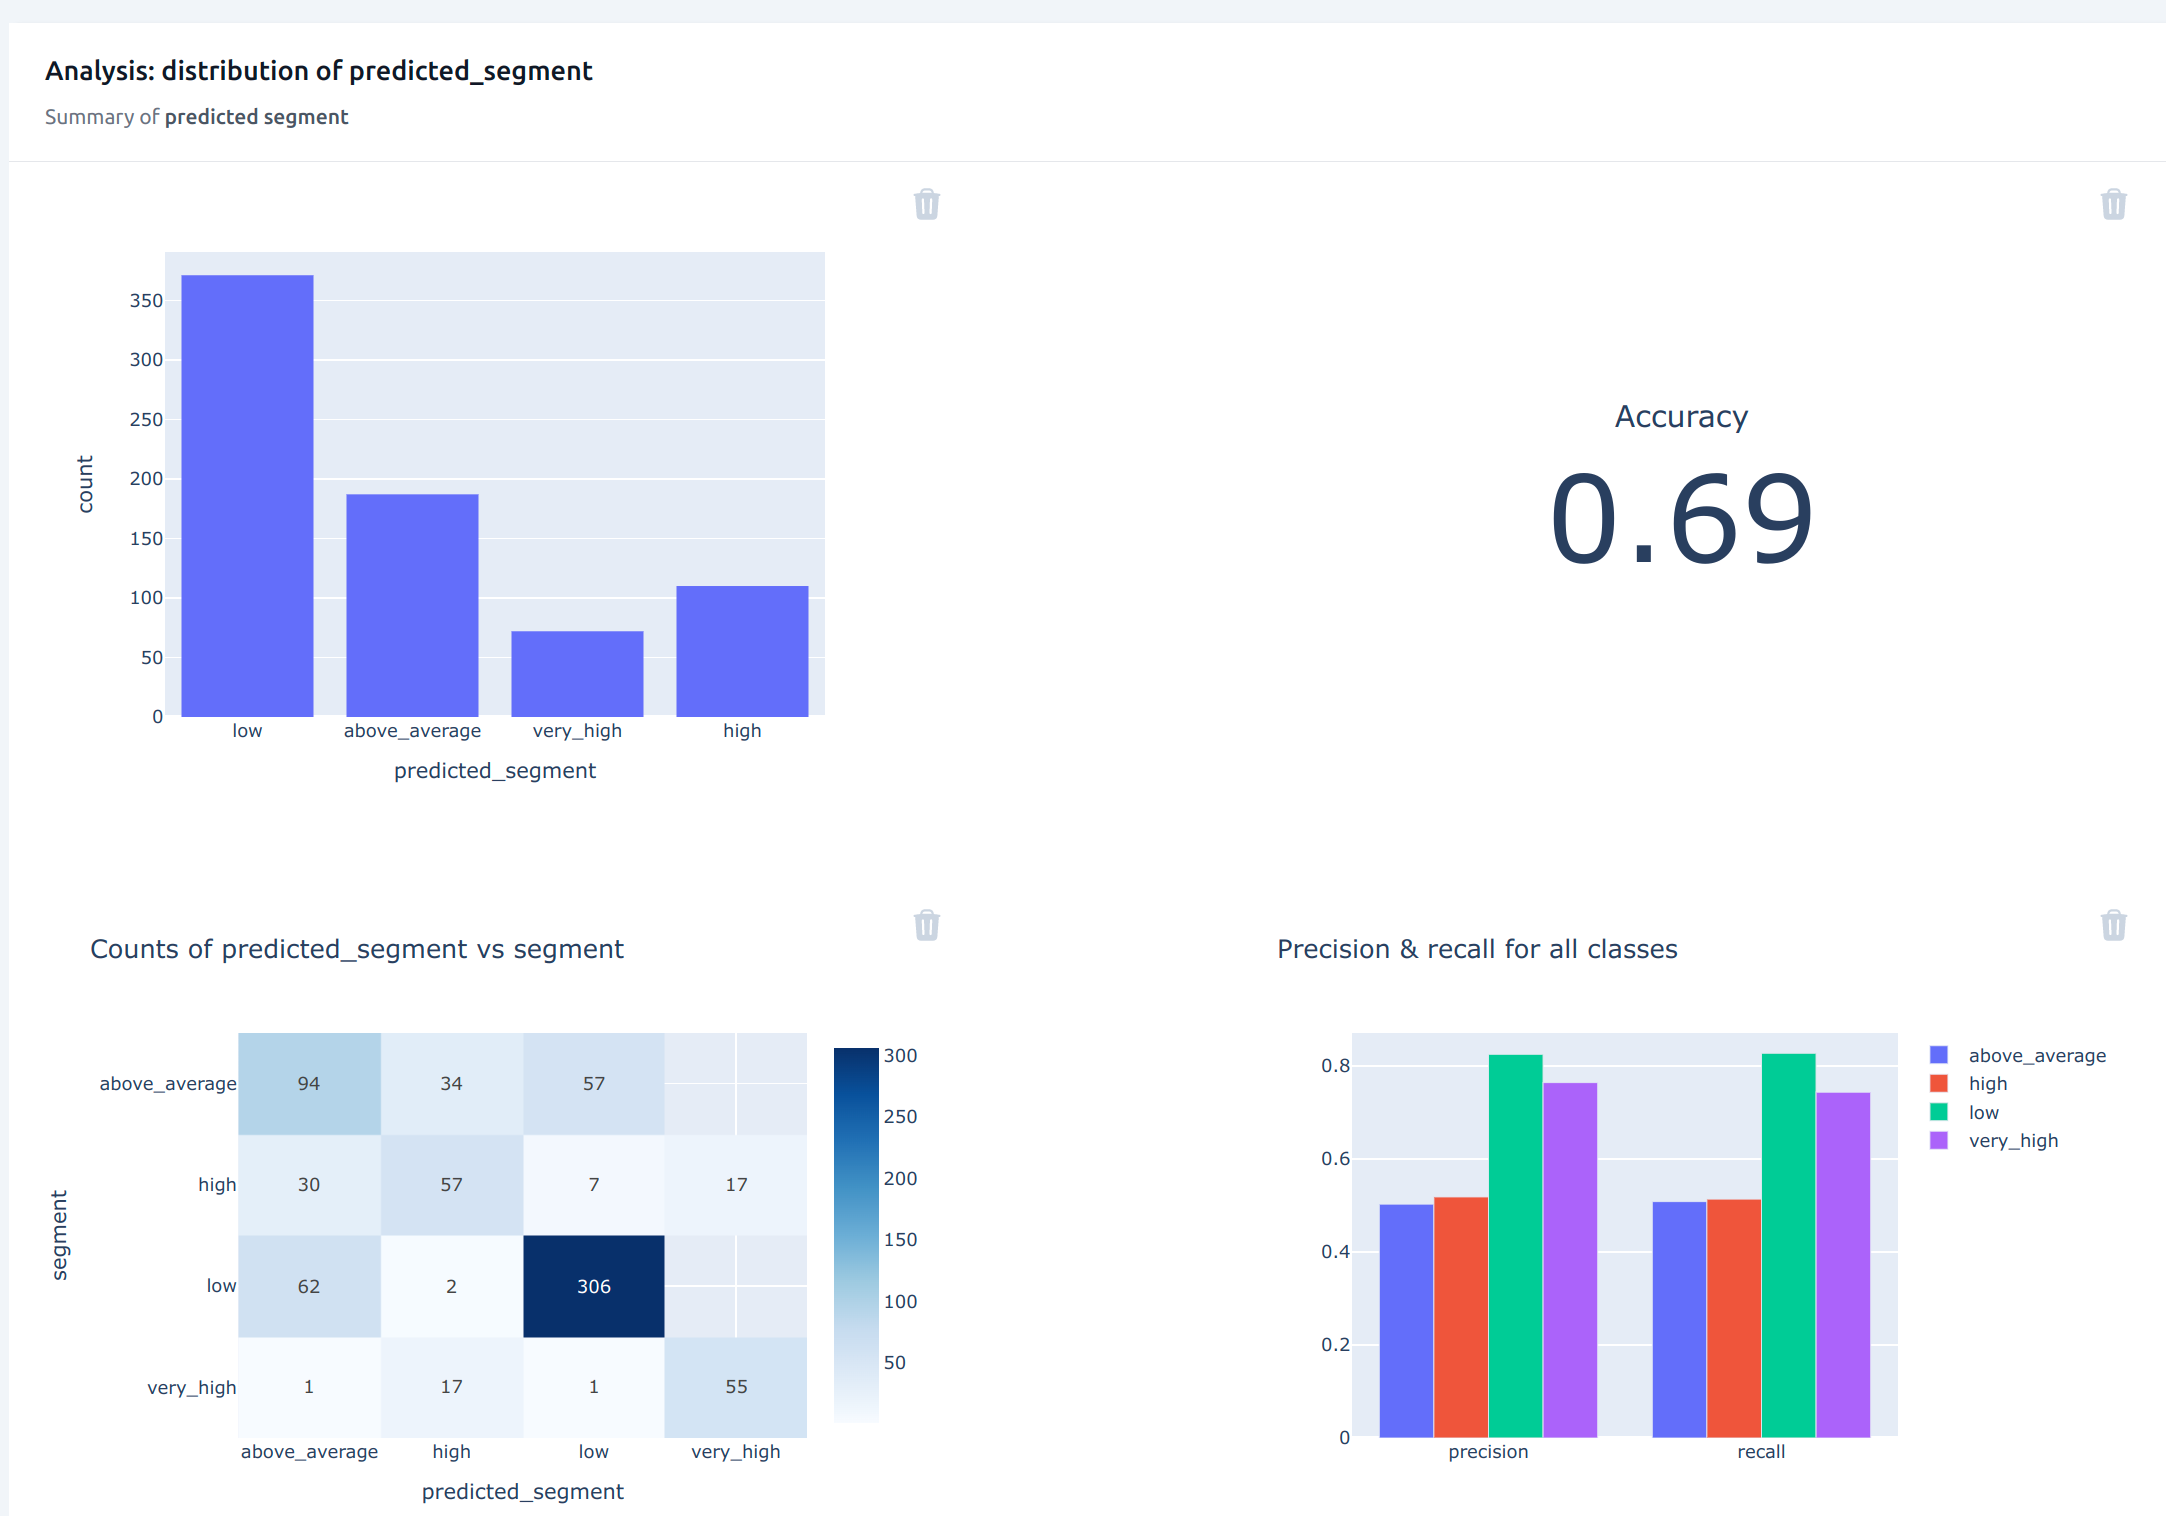
The marketing manager then decides to look at the overall predicted_segment. He sees that the accuracy is set at 0.69, but precision and recall for the “very high” segment is very high, which is the most important segment.
Detecting Anomalies in ML Results
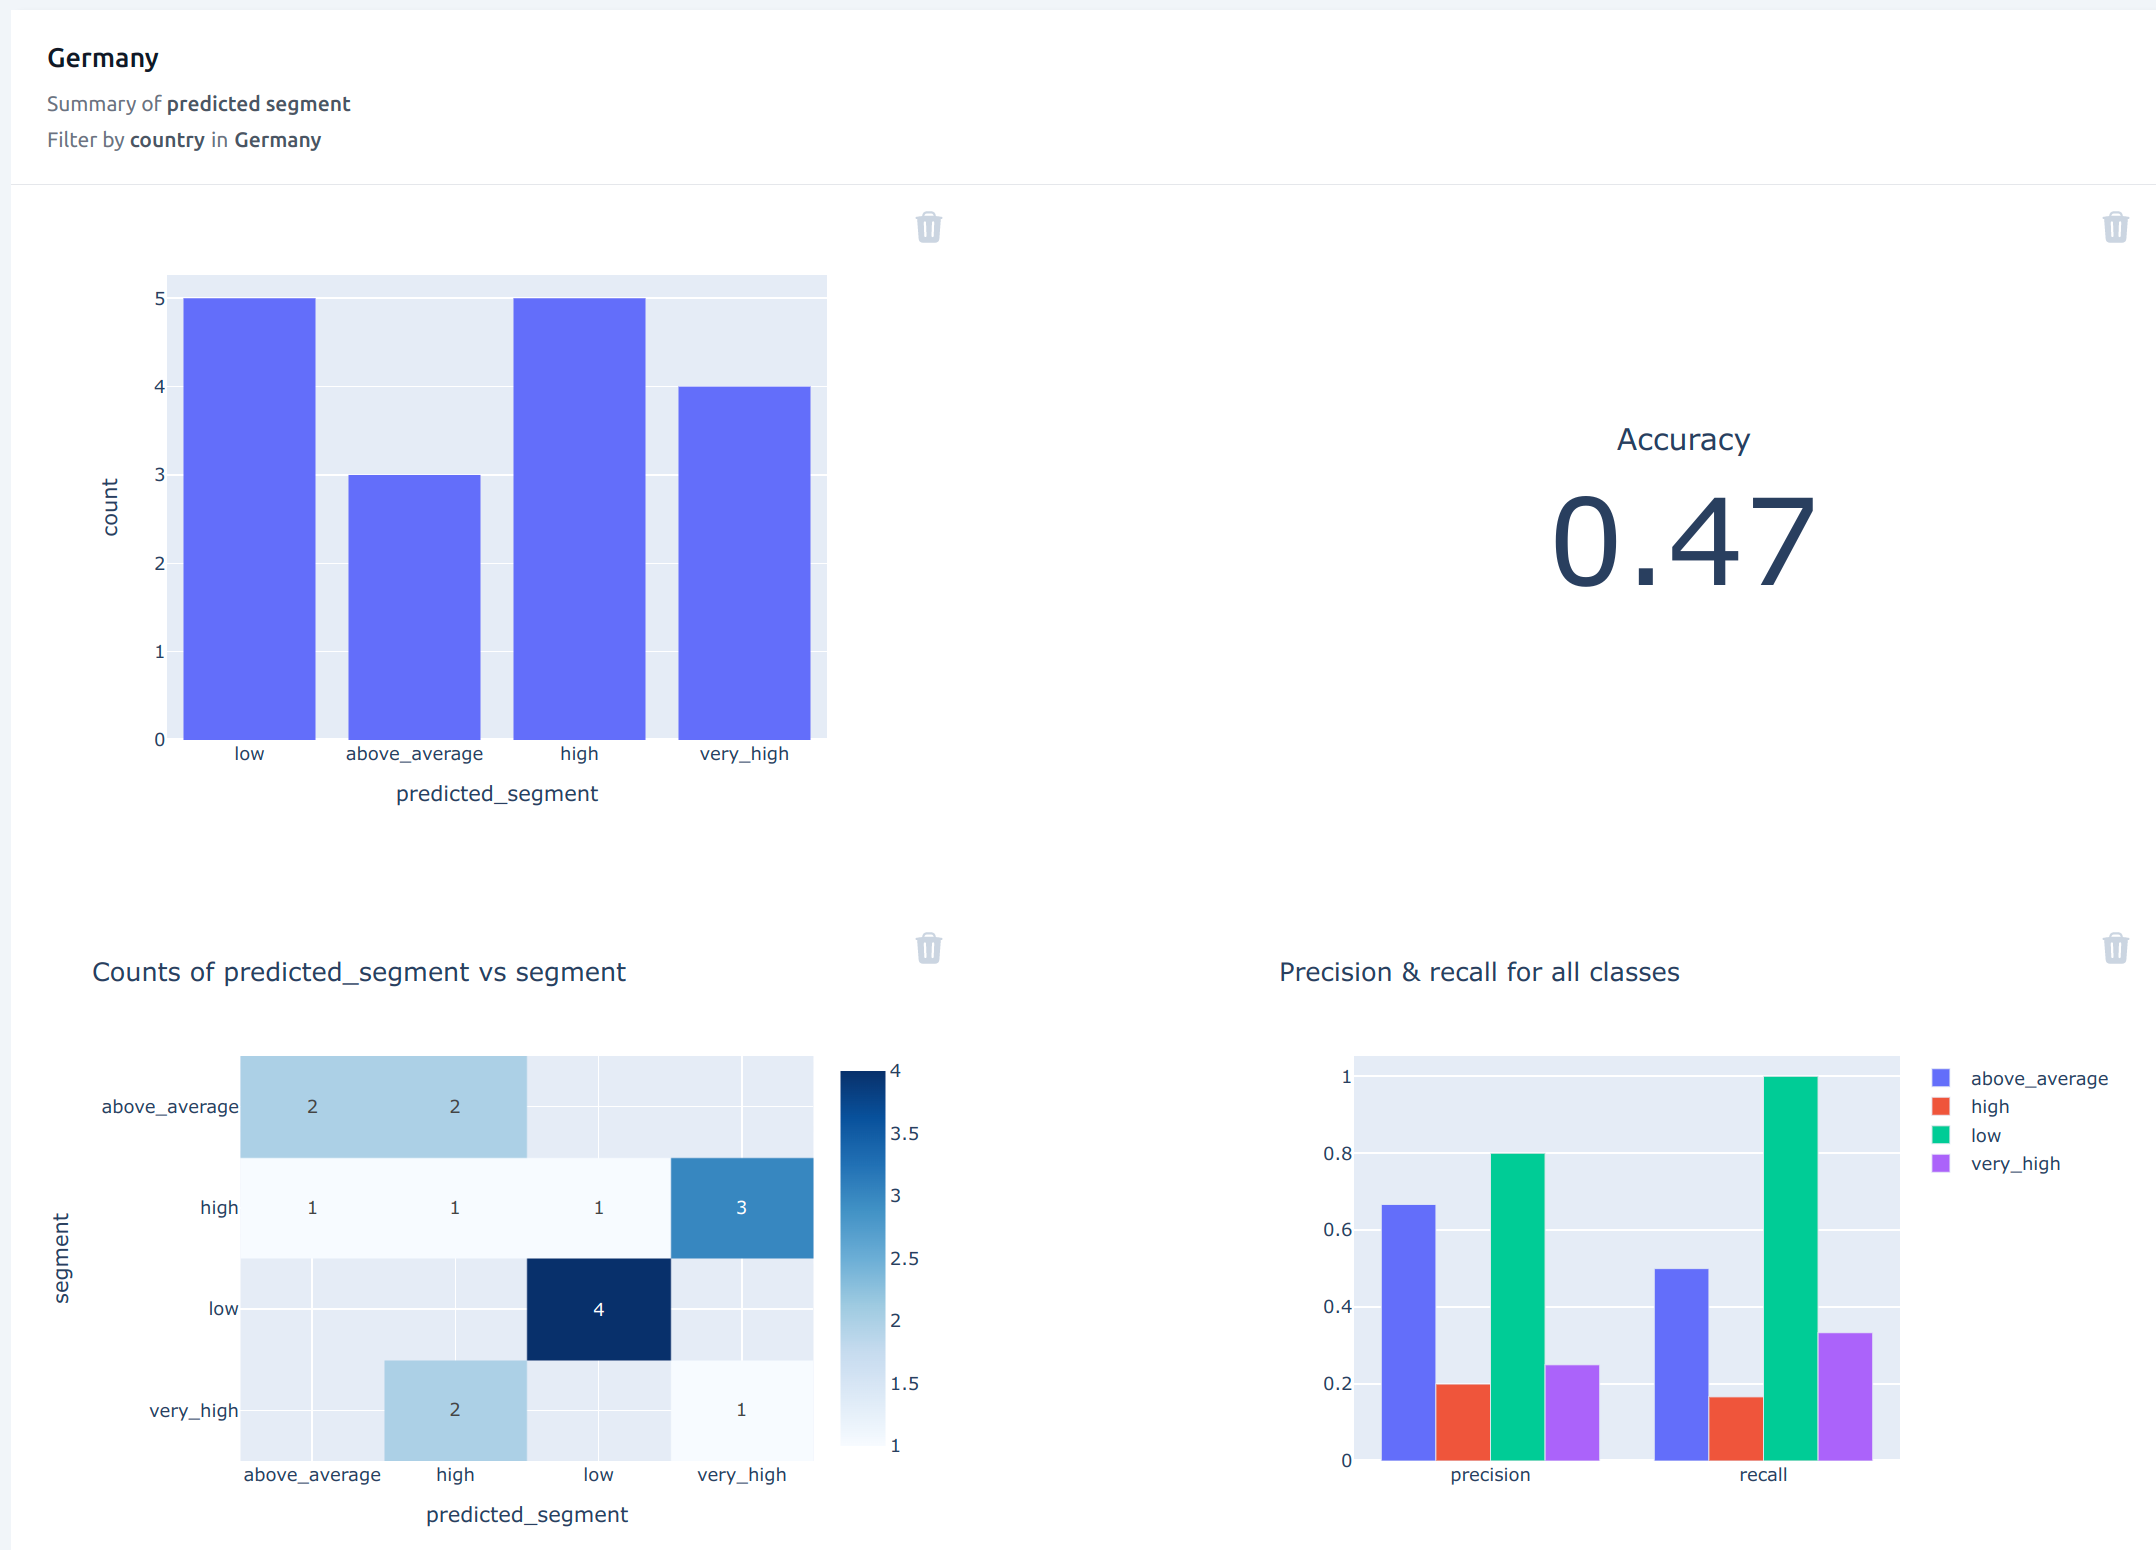
The manager knows that the company plans to expand their operations in Germany, which has a high proportion of high spenders. Making sure that the predictions are reasonably accurate for this country is thus important to the business.
He thus selects to view the predicted segment for Germany. The accuracy metric falls to 0.47, which is much lower than the overall accuracy seen before. And he notices that performance of the “very high” segment has dropped significantly.
He reports this to the data scientist, who decides to focus the next model iteration on getting better predictions for Germany.